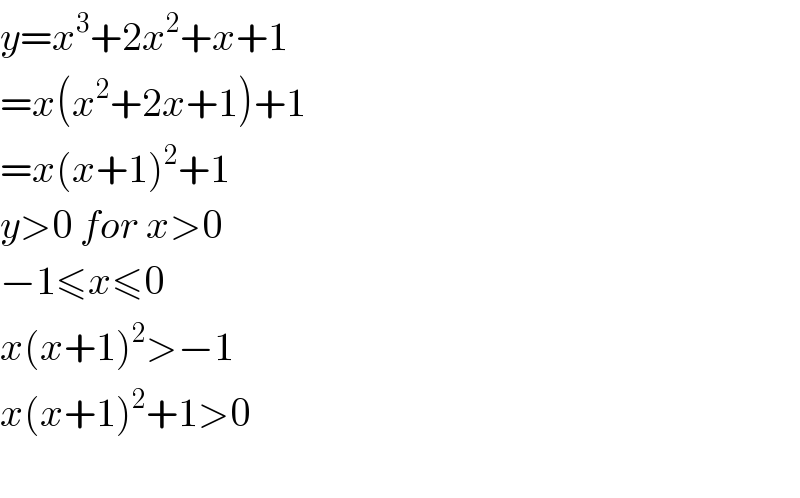
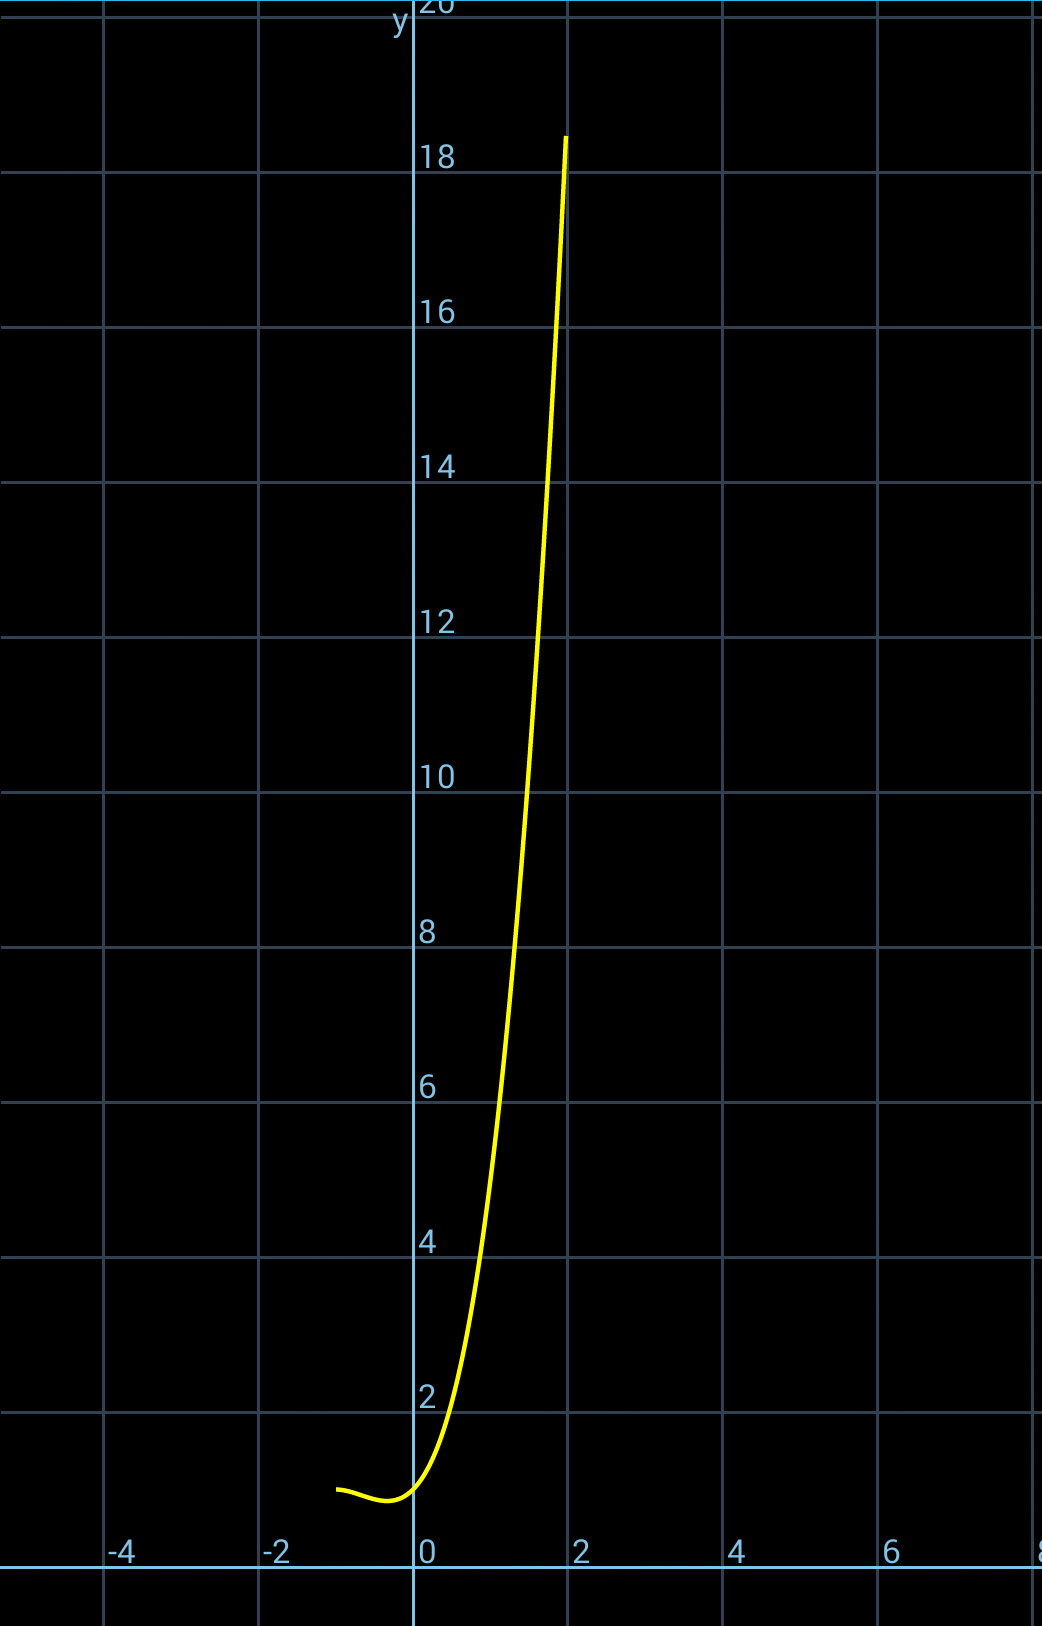
Show-that-the-graph-of-y-x-3-2x-2-x-1-between-x-1-and-x-2-lies-entirely-above-the-x-axis- Tinku Tara June 3, 2023 Coordinate Geometry 0 Comments FacebookTweetPin Question Number 11473 by tawa last updated on 26/Mar/17 Showthatthegraphofy=x3+2x2+x+1,betweenx=−1andx=2liesentirelyabovethex−axis Commented by prakash jain last updated on 28/Mar/17 y=x3+2x2+x+1=x(x2+2x+1)+1=x(x+1)2+1y>0forx>0−1⩽x⩽0x(x+1)2>−1x(x+1)2+1>0 Answered by sm3l2996 last updated on 26/Mar/17 Commented by tawa last updated on 26/Mar/17 Godblessyousir. Terms of Service Privacy Policy Contact: info@tinkutara.com FacebookTweetPin Post navigation Previous Previous post: Question-77009Next Next post: Question-11475 Leave a Reply Cancel replyYour email address will not be published. Required fields are marked *Comment * Name * Save my name, email, and website in this browser for the next time I comment.