
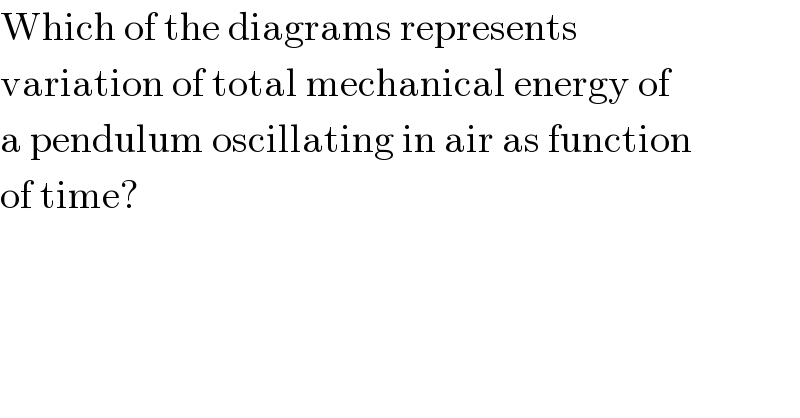
Question Number 23481 by Tinkutara last updated on 31/Oct/17
Commented by Tinkutara last updated on 01/Nov/17

Commented by Tinkutara last updated on 31/Oct/17
Commented by ajfour last updated on 31/Oct/17
Commented by Tinkutara last updated on 31/Oct/17

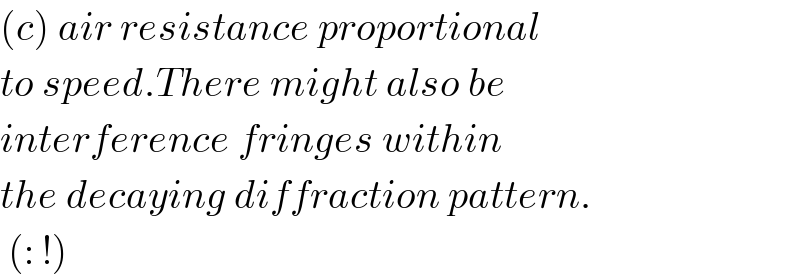
Commented by ajfour last updated on 31/Oct/17