Question and Answers Forum

All Questions      Topic List

None Questions

Previous in All Question      Next in All Question      

Previous in None      Next in None      

Question Number 113542 by Tinku Tara last updated on 13/Sep/20
App Update v2.203  A function plotter for one variable  is available. Steps to use  Insert Drawing  Insert Equation  select equation from the list of shape  tap on BUILD  and select plot  A sample plot is show as image below.  Line color for plot can be changed  using edit shape menu  to change range of x values select  scale from options menu.  to zoomin/out use option menu  to scroll with zoom: clear selection and  place touch in move mode.  You can add multiple plots on  one drawing and also add another  drawing on the canvas.

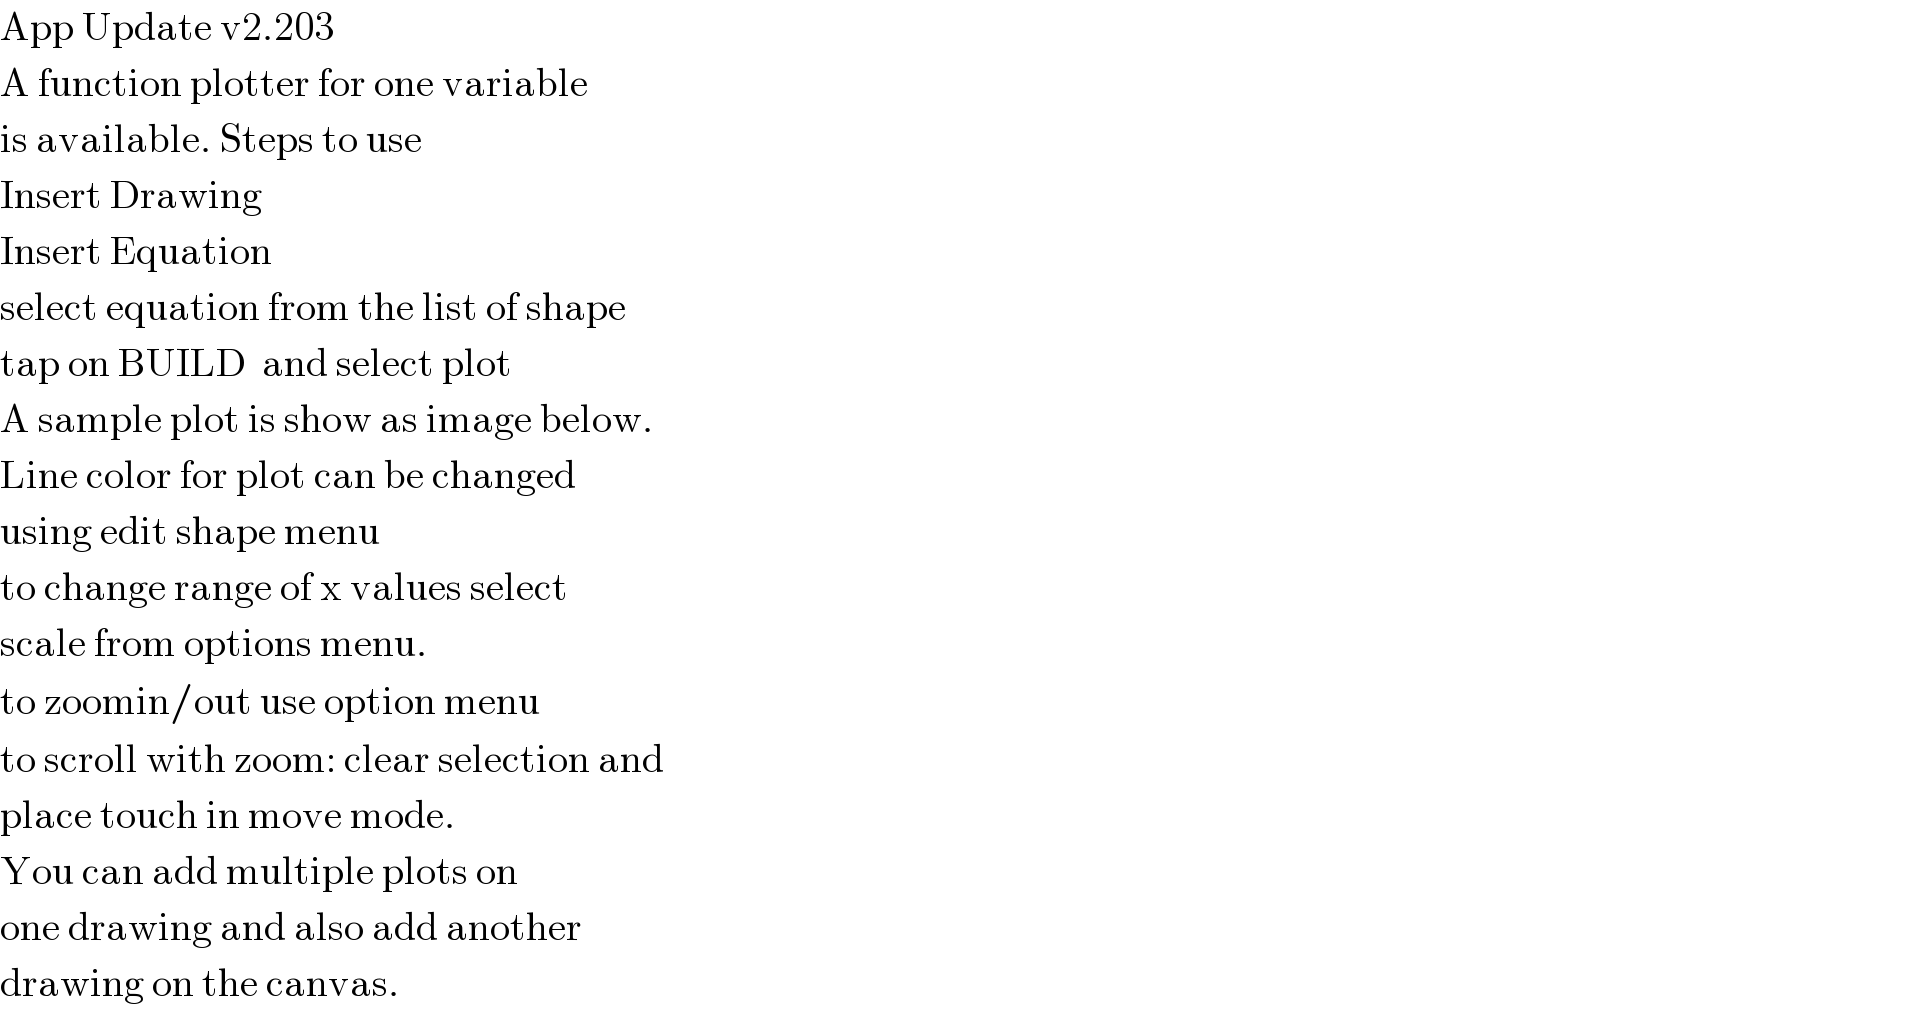
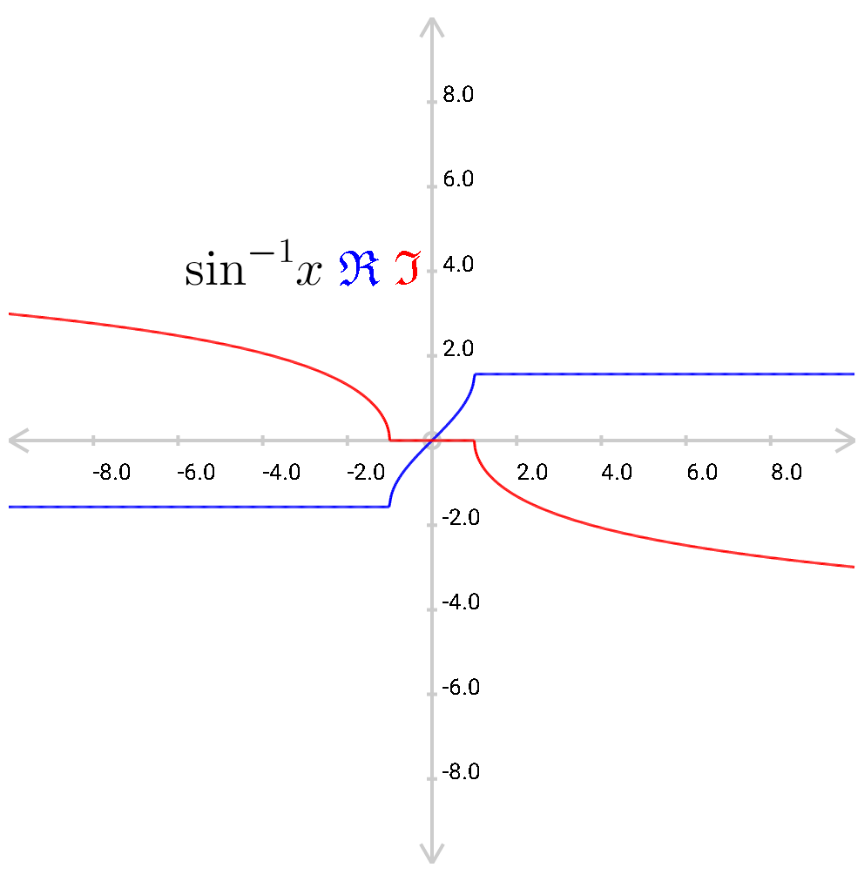
$$\mathrm{App}\:\mathrm{Update}\:\mathrm{v2}.\mathrm{203} \\ $$$$\mathrm{A}\:\mathrm{function}\:\mathrm{plotter}\:\mathrm{for}\:\mathrm{one}\:\mathrm{variable} \\ $$$$\mathrm{is}\:\mathrm{available}.\:\mathrm{Steps}\:\mathrm{to}\:\mathrm{use} \\ $$$$\mathrm{Insert}\:\mathrm{Drawing} \\ $$$$\mathrm{Insert}\:\mathrm{Equation} \\ $$$$\mathrm{select}\:\mathrm{equation}\:\mathrm{from}\:\mathrm{the}\:\mathrm{list}\:\mathrm{of}\:\mathrm{shape} \\ $$$$\mathrm{tap}\:\mathrm{on}\:\mathrm{BUILD}\:\:\mathrm{and}\:\mathrm{select}\:\mathrm{plot} \\ $$$$\mathrm{A}\:\mathrm{sample}\:\mathrm{plot}\:\mathrm{is}\:\mathrm{show}\:\mathrm{as}\:\mathrm{image}\:\mathrm{below}. \\ $$$$\mathrm{Line}\:\mathrm{color}\:\mathrm{for}\:\mathrm{plot}\:\mathrm{can}\:\mathrm{be}\:\mathrm{changed} \\ $$$$\mathrm{using}\:\mathrm{edit}\:\mathrm{shape}\:\mathrm{menu} \\ $$$$\mathrm{to}\:\mathrm{change}\:\mathrm{range}\:\mathrm{of}\:\mathrm{x}\:\mathrm{values}\:\mathrm{select} \\ $$$$\mathrm{scale}\:\mathrm{from}\:\mathrm{options}\:\mathrm{menu}. \\ $$$$\mathrm{to}\:\mathrm{zoomin}/\mathrm{out}\:\mathrm{use}\:\mathrm{option}\:\mathrm{menu} \\ $$$$\mathrm{to}\:\mathrm{scroll}\:\mathrm{with}\:\mathrm{zoom}:\:\mathrm{clear}\:\mathrm{selection}\:\mathrm{and} \\ $$$$\mathrm{place}\:\mathrm{touch}\:\mathrm{in}\:\mathrm{move}\:\mathrm{mode}. \\ $$$$\mathrm{You}\:\mathrm{can}\:\mathrm{add}\:\mathrm{multiple}\:\mathrm{plots}\:\mathrm{on} \\ $$$$\mathrm{one}\:\mathrm{drawing}\:\mathrm{and}\:\mathrm{also}\:\mathrm{add}\:\mathrm{another} \\ $$$$\mathrm{drawing}\:\mathrm{on}\:\mathrm{the}\:\mathrm{canvas}. \\ $$

Commented by Tinku Tara last updated on 13/Sep/20
Commented by Tinku Tara last updated on 13/Sep/20
R and I indicate real and imaginary  part. Text color of these are same  as line color.  R and I are automatically added  once you plot and equation and  color will change once line color of  graph is changed.  A video tutorial for plotting  function will be available soon.

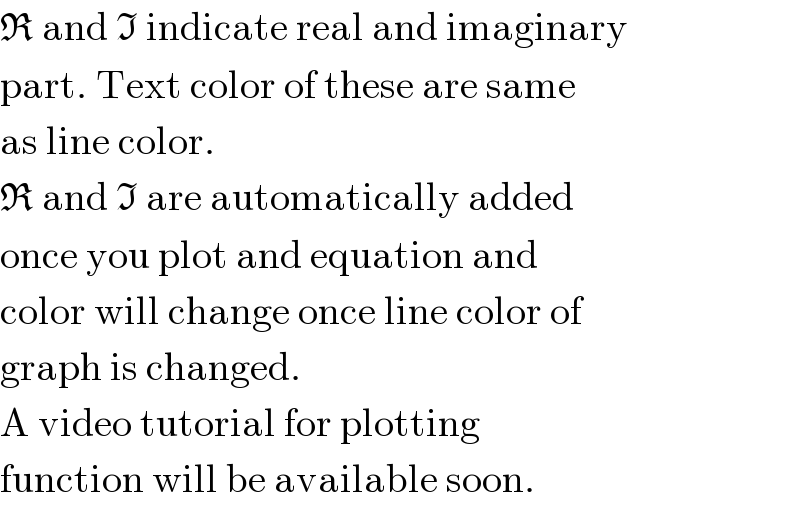
$$\mathfrak{R}\:\mathrm{and}\:\mathfrak{I}\:\mathrm{indicate}\:\mathrm{real}\:\mathrm{and}\:\mathrm{imaginary} \\ $$$$\mathrm{part}.\:\mathrm{Text}\:\mathrm{color}\:\mathrm{of}\:\mathrm{these}\:\mathrm{are}\:\mathrm{same} \\ $$$$\mathrm{as}\:\mathrm{line}\:\mathrm{color}. \\ $$$$\mathfrak{R}\:\mathrm{and}\:\mathfrak{I}\:\mathrm{are}\:\mathrm{automatically}\:\mathrm{added} \\ $$$$\mathrm{once}\:\mathrm{you}\:\mathrm{plot}\:\mathrm{and}\:\mathrm{equation}\:\mathrm{and} \\ $$$$\mathrm{color}\:\mathrm{will}\:\mathrm{change}\:\mathrm{once}\:\mathrm{line}\:\mathrm{color}\:\mathrm{of} \\ $$$$\mathrm{graph}\:\mathrm{is}\:\mathrm{changed}. \\ $$$$\mathrm{A}\:\mathrm{video}\:\mathrm{tutorial}\:\mathrm{for}\:\mathrm{plotting} \\ $$$$\mathrm{function}\:\mathrm{will}\:\mathrm{be}\:\mathrm{available}\:\mathrm{soon}. \\ $$

Terms of Service

Privacy Policy

Contact: info@tinkutara.com